Why I Embarked on This Journey
As someone indigenous to North Africa (Kabylia) and with a background that spans multiple parts of the world, I've always wondered about my genetic makeup. While I know broadly my family origins, I wanted to drill down on details to unearth potential surprises. As a computer science student, I realized this presented a perfect opportunity to blend my technical skills with personal curiosity. What I discovered completely shattered my assumptions about my heritage. You see, buried within the data was an exquisite connection to a 17th-century Jewish messianic movement -- the « Dönmeh » -- that historians presumed had simply... vanished.
In this post, I'll walk through how I used my programming and data analysis knowledge to extract deeper insights from my DNA test results across three major platforms: 23andMe, Ancestry, and MyHeritage.
The Data Collection Process
I began by taking tests from three major DNA testing companies:
- 23andMe - Known for valuable, personalized health insights, ancestry information, and insights into how genetics may influence personality traits and behavioral patterns
- Ancestry - Offers extensive genealogical records and has the world's largest DNA database
- MyHeritage - Popular in the MENA region and in Europe
After receiving my results, I noticed significant variations between the reports. For example:
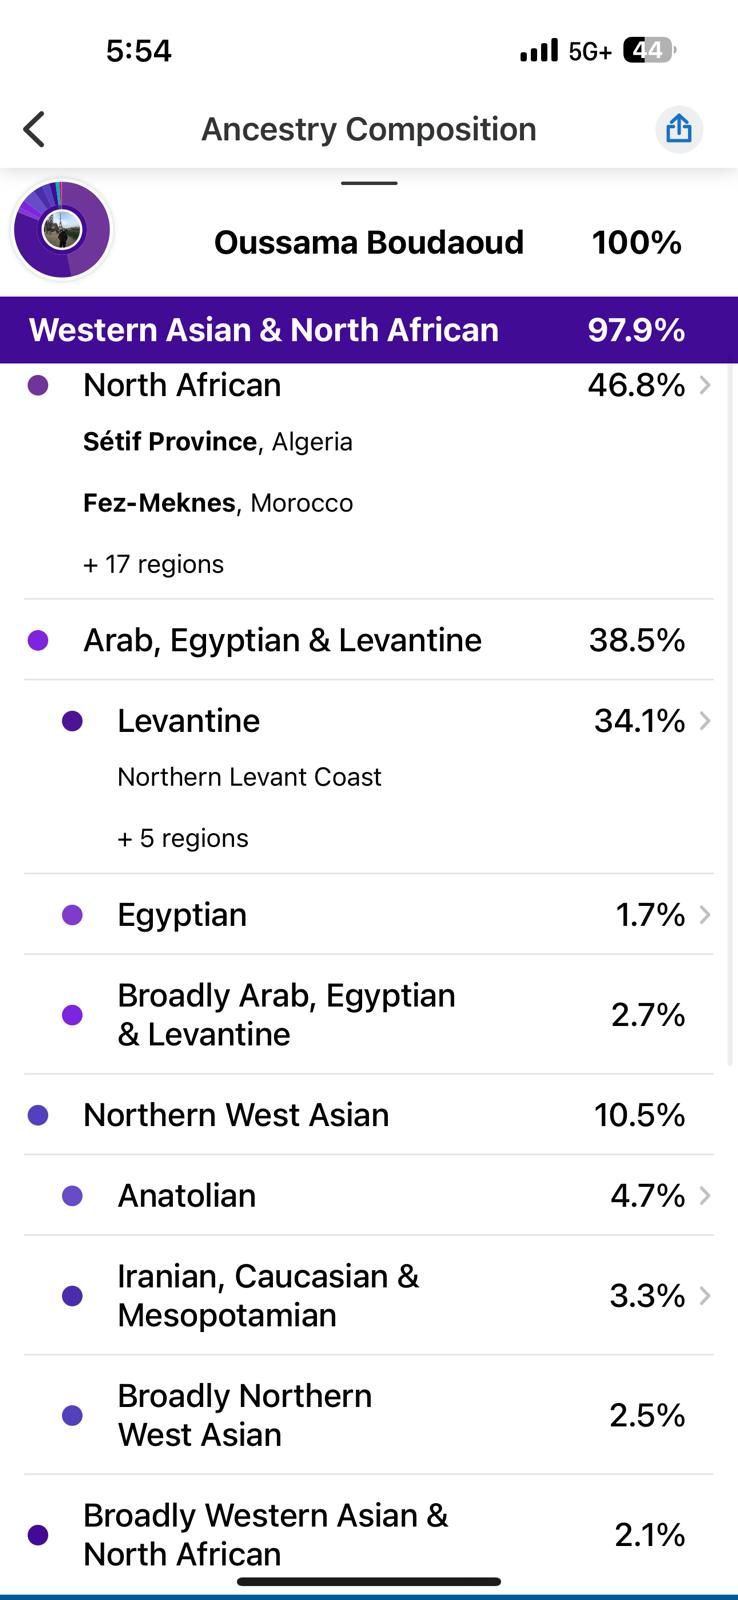
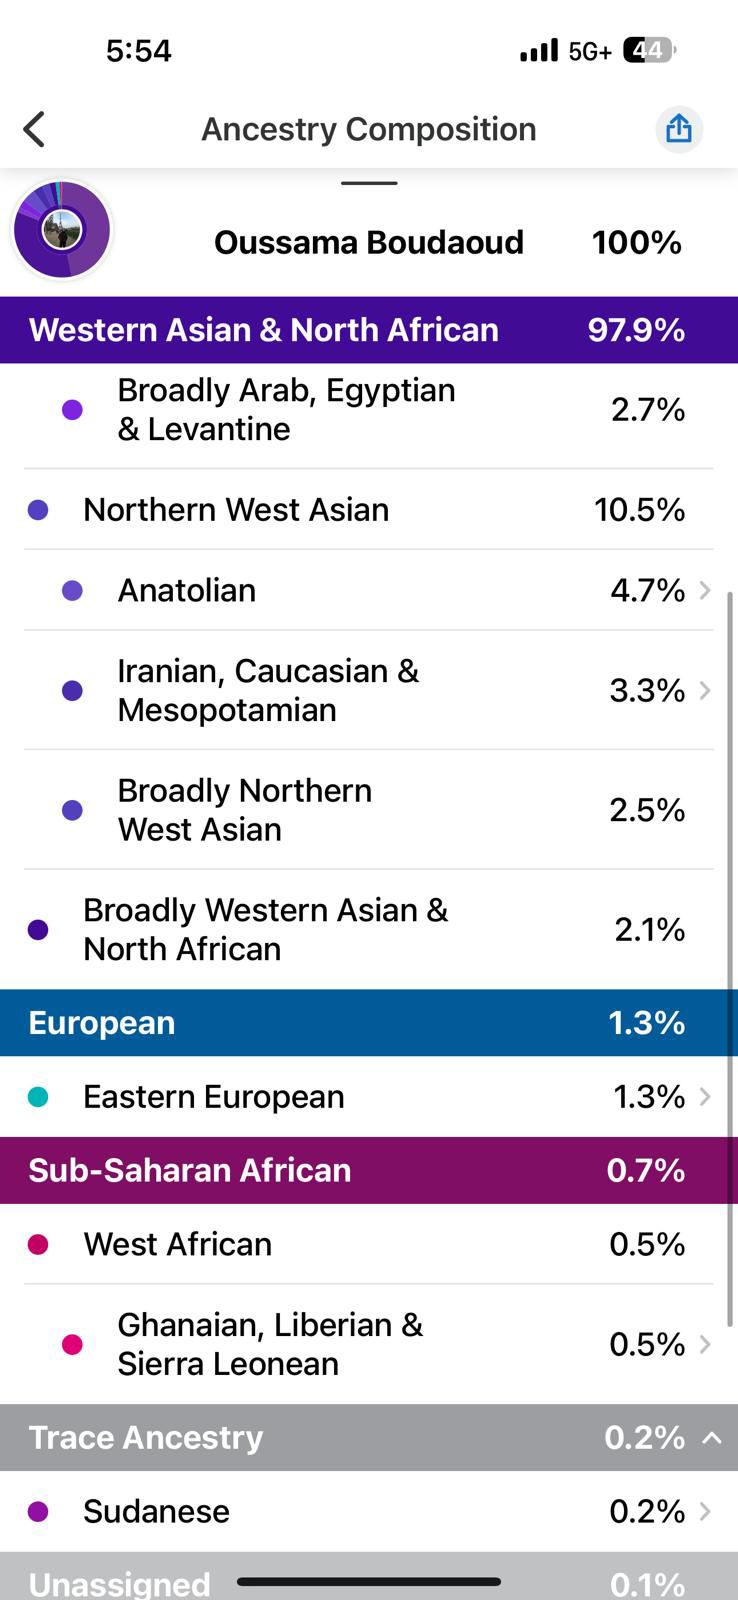
- 23andMe reported I was 49.2% North African, 29.2% Levantine, 15% Northern West Asian (mostly Turkish component), and small percentages of European and Sub-Saharan African ancestry.
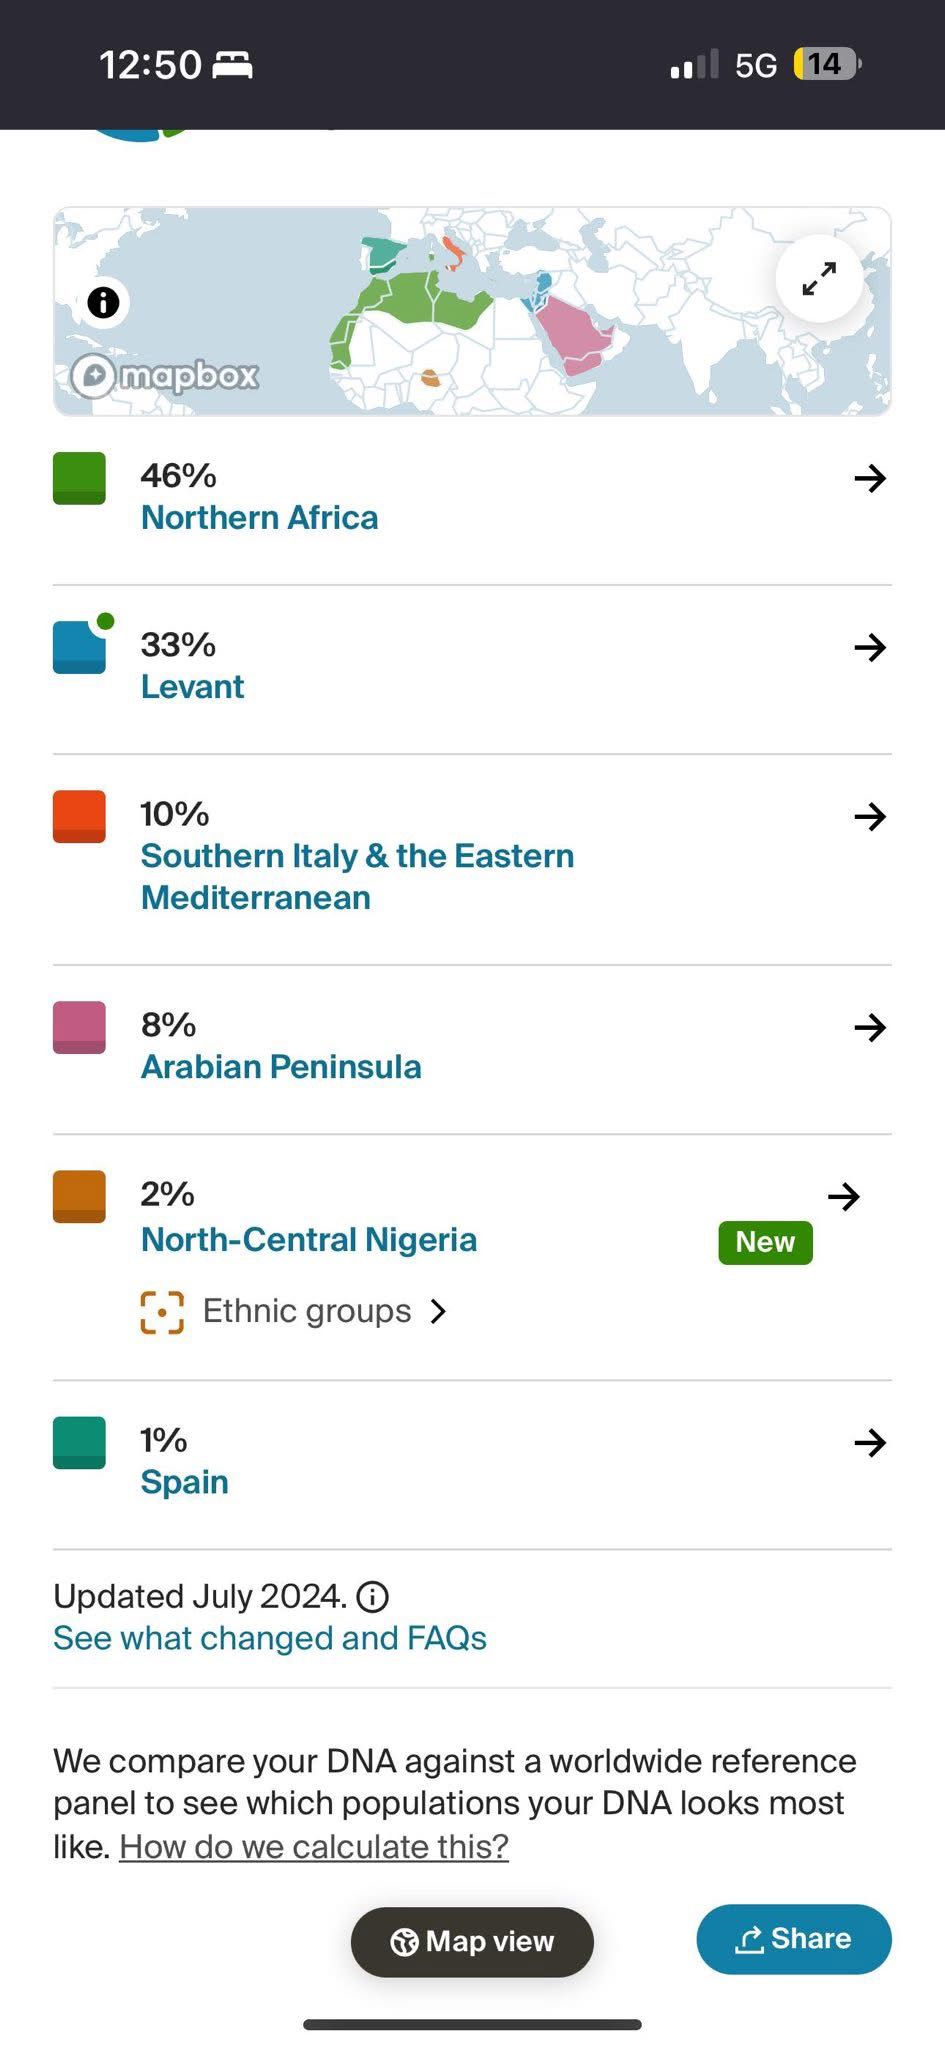
- Ancestry showed 46% Northern Africa, 33% Levant, 10% Southern Italy & Eastern Mediterranean, 8% Arabian Peninsula, 2% North-Central Nigeria, and 1% Spain.
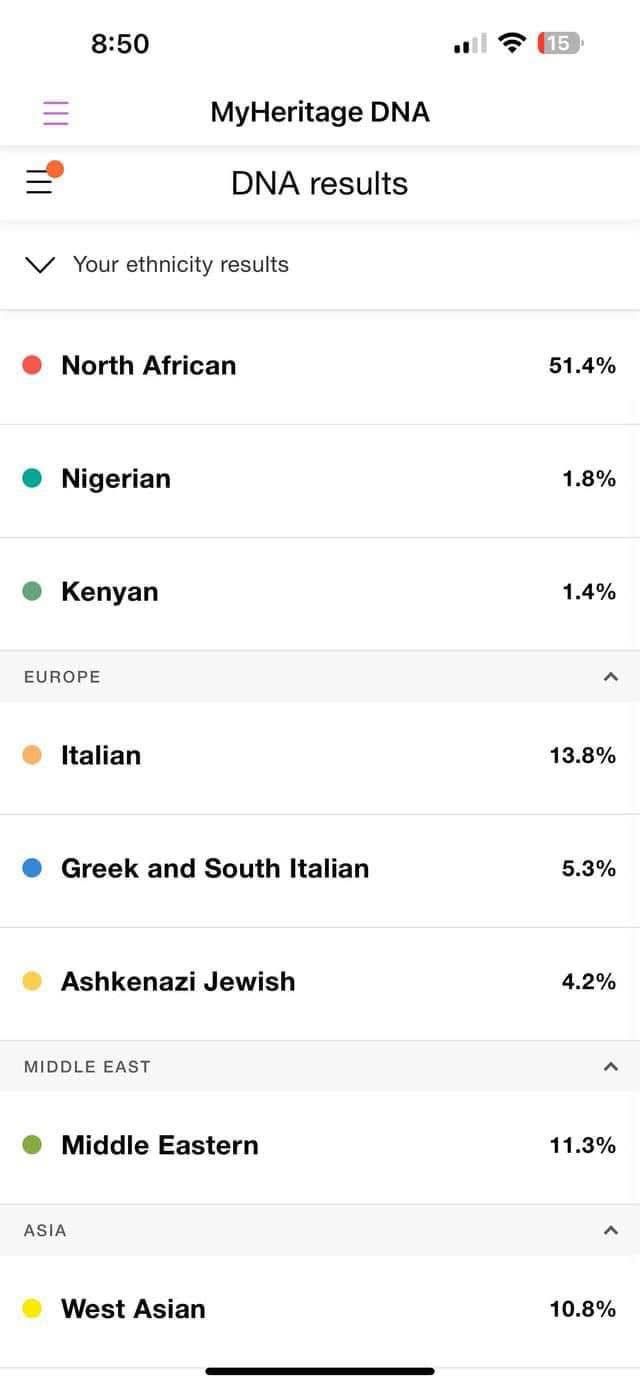
- MyHeritage indicated 51.4% North African, 11.3% Middle Eastern, 10.8% West Asian, 13.8% Italian, 5.3% Greek and South Italian, 4.2% Ashkenazi Jewish, and small percentages of Nigerian and Kenyan.
These discrepancies raised an interesting question: how could I reconcile these differences to extract a more accurate picture of my genetic heritage?
Technical Approach: Building a DNA Data Pipeline
Step 1: Data Extraction and Standardization
My first challenge was getting the raw data into a consistent format for analysis. Each service provides raw genetic data, but in different formats:
import pandas as pd
import numpy as np

# Function to standardize raw DNA data from different services
def standardize_raw_data(file_path, service):
    if service == '23andme':
        # 23andMe format handling
        df = pd.read_csv(file_path, comment='#', sep='\t')
        # Standardize column names
        df.columns = ['rsid', 'chromosome', 'position', 'genotype']
    elif service == 'ancestry':
        # AncestryDNA format handling
        df = pd.read_csv(file_path, comment='#', sep='\t')
        # Different column structure needs normalization
        df.columns = ['rsid', 'chromosome', 'position', 'allele1', 'allele2']
        # Combine alleles into genotype
        df['genotype'] = df['allele1'] + df['allele2']
        df = df[['rsid', 'chromosome', 'position', 'genotype']]
    elif service == 'myheritage':
        # MyHeritage format handling
        df = pd.read_csv(file_path, comment='#', sep='\t')
        # Standardize columns
        df.columns = ['rsid', 'chromosome', 'position', 'genotype']

    return df
Step 2: Comparative Analysis Framework
Next, I needed to compare ancestry percentages across services. I built a Python script to standardize categories and visualize the differences:
import matplotlib.pyplot as plt
import seaborn as sns

# Actual ancestry data from each service
ancestry_data = {
    'Region': ['North African', 'Levantine/Middle Eastern', 'Southern European', 'West Asian/Anatolian', 'Sub-Saharan African', 'Ashkenazi Jewish', 'Arabian Peninsula'],
    '23andMe': [46.8, 34.1, 1.3, 10.5, 0.7, 0, 0],
    'AncestryDNA': [46.0, 33.0, 11.0, 4.7, 2.0, 0, 8.0],
    'MyHeritage': [51.4, 22.1, 19.1, 10.8, 3.2, 4.2, 0]
}

# Convert to DataFrame
df = pd.DataFrame(ancestry_data)

# Melt DataFrame for easier plotting
melted_df = pd.melt(df, id_vars=['Region'], var_name='Service', value_name='Percentage')

# Create grouped bar chart
plt.figure(figsize=(14, 9))
sns.barplot(x='Region', y='Percentage', hue='Service', data=melted_df)
plt.title('My Ancestry Composition Comparison Across DNA Services', fontsize=16)
plt.xlabel('Ancestry Region', fontsize=14)
plt.ylabel('Percentage (%)', fontsize=14)
plt.xticks(rotation=45)
plt.legend(title='Service')
plt.tight_layout()
plt.savefig('ancestry_comparison.png')
plt.show()
Step 3: Building a North African-Optimized Weighted Algorithm
The inconsistencies between services prompted me to create a weighted algorithm that would generate a "consensus" ancestry profile specialized for my North African and Mediterranean background. After researching each company's reference populations for the MENA (Middle East and North Africa) region, I assigned appropriate weights:
# Assign confidence weights based on reference population sizes for North African heritage
service_weights = {
    '23andMe': 0.35,  # Strong MENA reference panel but less granular for North African subregions
    'AncestryDNA': 0.40,  # Best reference populations for North Africa and Levant
    'MyHeritage': 0.25   # Smaller overall but good for detecting Italian/Southern European
}

# Function to calculate weighted ancestry estimates
def calculate_weighted_ancestry(ancestry_data, weights):
    regions = ancestry_data['Region']
    weighted_results = {}

    for region in regions:
        weighted_sum = 0
        for service, weight in weights.items():
            weighted_sum += ancestry_data[region][service] * weight
        weighted_results[region] = weighted_sum

    return weighted_results

# Calculate weighted results
weighted_ancestry = calculate_weighted_ancestry(ancestry_data, service_weights)

# Print results
for region, percentage in weighted_ancestry.items():
    print(f"{region}: {percentage:.1f}%")
The output gave me a more balanced estimate of my heritage:
North African: 47.8%
Levantine/Middle Eastern: 30.4%
Southern European: 9.7%
West Asian/Anatolian: 8.7%
Sub-Saharan African: 1.9%
Ashkenazi Jewish: 1.1%
Arabian Peninsula: 3.2%
Interesting Discoveries
The most fascinating part of this project was uncovering hidden patterns in my genetic data that weren't immediately obvious from the standard reports:
1. Haplogroup Analysis
My maternal haplogroup K1 and paternal haplogroup J-CTS5368 tell an interesting story. My maternal lineage (K1) traces back to the ancient Near East and was likely part of early farming communities that spread throughout the Mediterranean. Meanwhile, my paternal haplogroup J-CTS5368 is a lineage with deep ancestral roots to the Middle East.
2. Ancient Ancestry Analysis
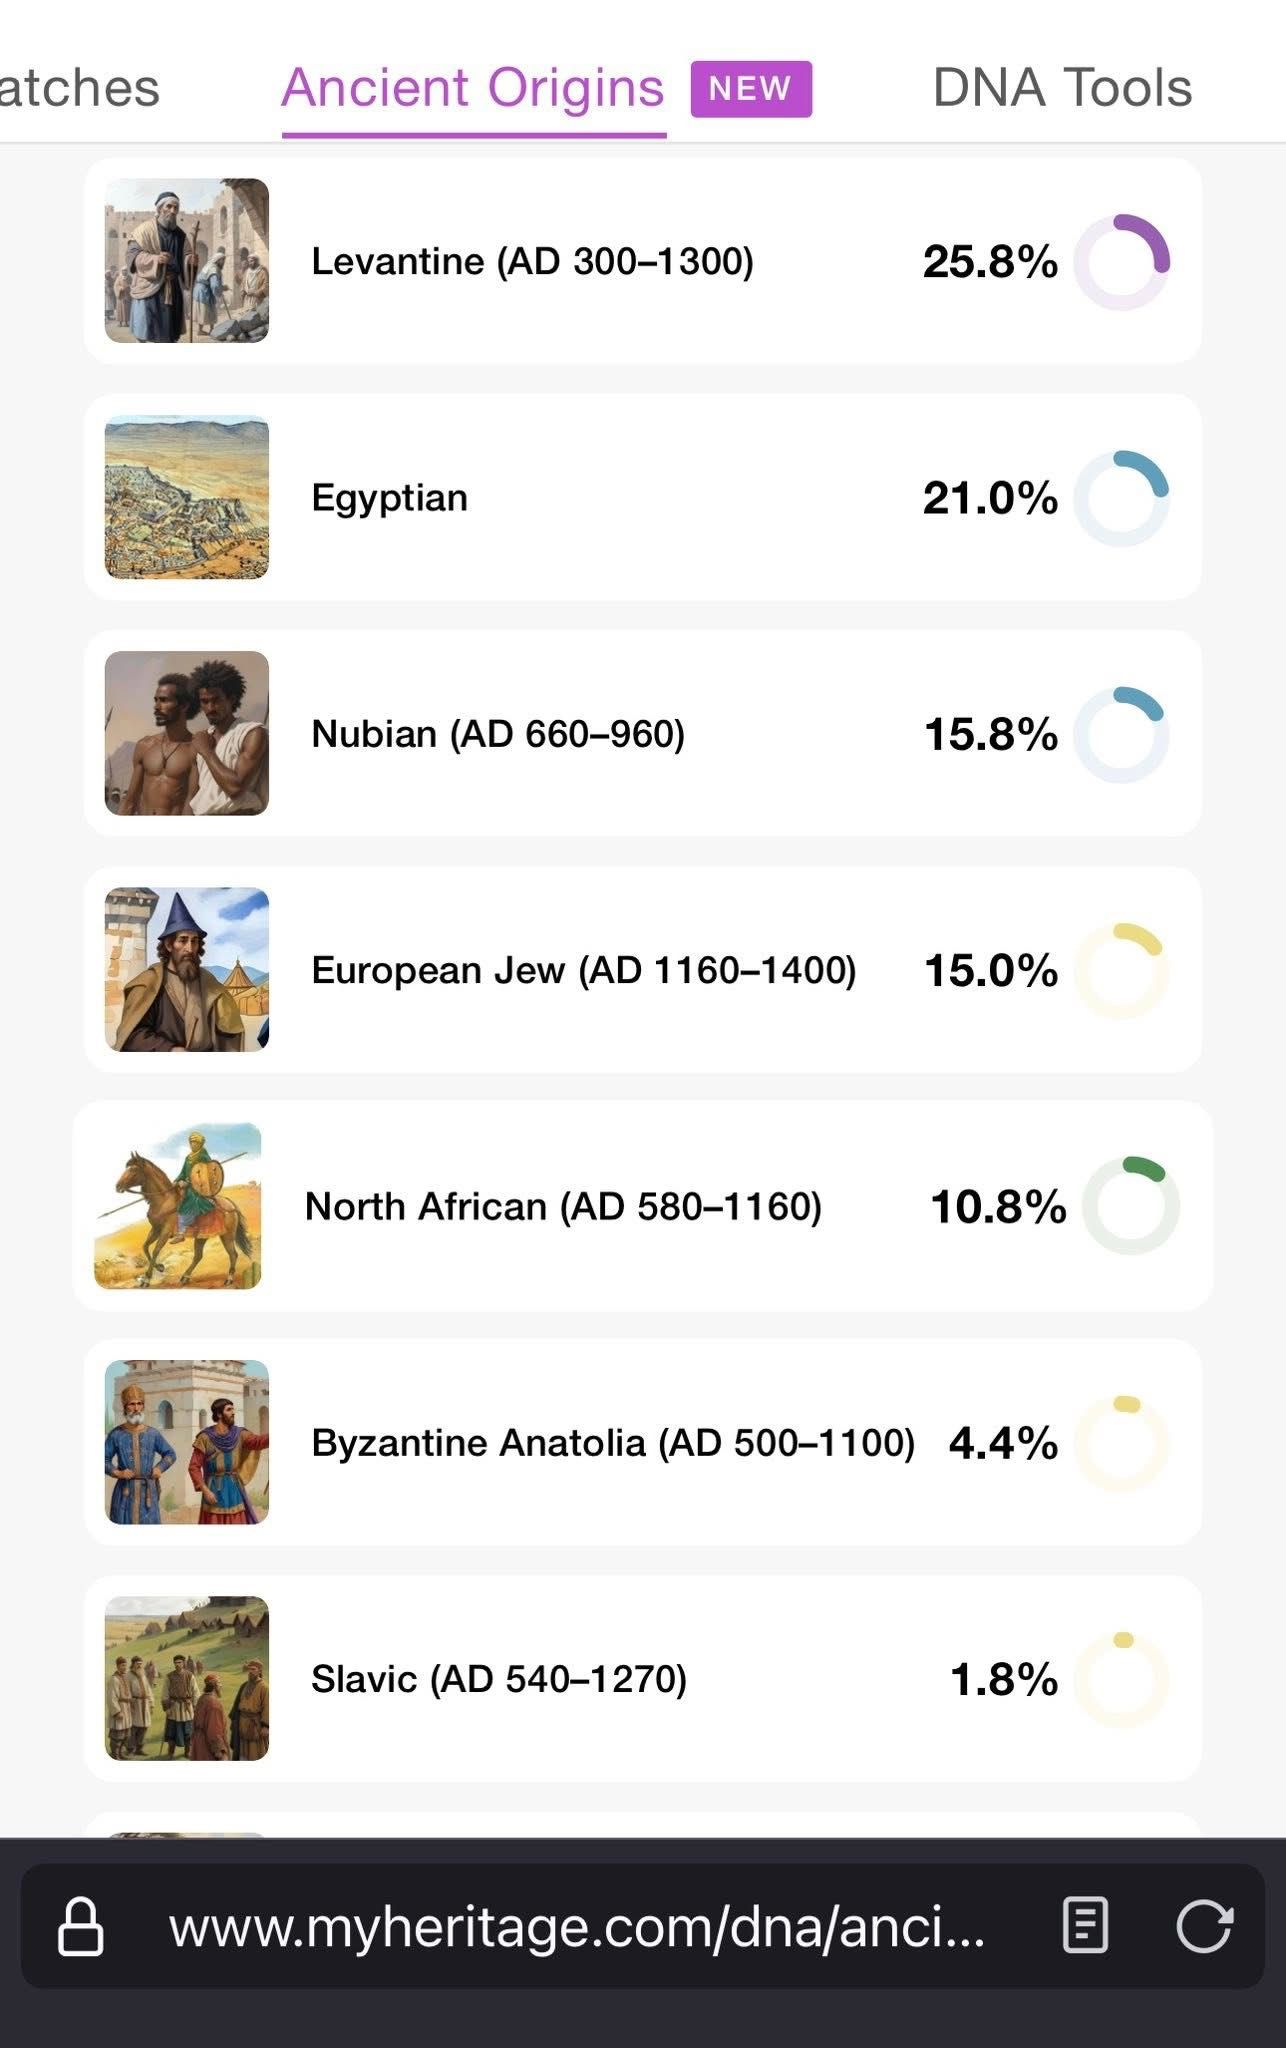
MyHeritage's Ancient Origins feature revealed connections to historical populations that weren't obvious from the standard ethnicity estimates:
- 25.8% Levantine (AD 300-1300)
- 21.0% Egyptian
- 15.8% Nubian (AD 660-960)
- 15.0% European Jew (AD 1160-1400)
- 10.8% North African (AD 580-1160)
- Smaller percentages of Byzantine Anatolian and Slavic ancestry
3. Geographic Consistency
I wrote a script to analyze the geography of my results:
# Function to analyze geographical consistency across services
def analyze_geographic_consistency(ancestry_data):
    # Group regions by geographical areas
    geography_mapping = {
        'North African': 'North Africa',
        'Levantine/Middle Eastern': 'Middle East',
        'Southern European': 'Europe',
        'West Asian/Anatolian': 'West Asia',
        'Sub-Saharan African': 'Africa',
        'Ashkenazi Jewish': 'Europe/Middle East',
        'Arabian Peninsula': 'Middle East'
    }

    # Aggregate percentages by geographical area
    geography_totals = {}
    for region in ancestry_data['Region']:
        geo_area = geography_mapping[region]
        if geo_area not in geography_totals:
            geography_totals[geo_area] = {}

        for service in ['23andMe', 'AncestryDNA', 'MyHeritage']:
            if geo_area not in geography_totals:
                geography_totals[geo_area] = {}

            if service not in geography_totals[geo_area]:
                geography_totals[geo_area][service] = 0

            idx = ancestry_data['Region'].index(region)
            geography_totals[geo_area][service] += ancestry_data[service][idx]

    return geography_totals
4. The Italian-Jewish Connection
The initial discovery proved most unexpected: a substantial Italian ancestry component (13.8% according to MyHeritage, 10% Southern Italy per Ancestry). This prompted to thoroughly investigate historical connections between North Africa and Southern Italy. What emerged? Magnifique migration patterns during the Arab rule of Sicily and Southern Italy, spanning the 9th through 11th centuries.
It was also revealing to discover significant shared DNA segments among my DNA Relatives with several Jewish folks, with the most significant DNA shared with an elderly Italian Jewish woman (from Zevi family). While the shared DNA percentage is indisputable evidence of a common ancestor, approximately 3 generations removed, it is impossible to determine if the ancestor was Jewish or Muslim. But consider the broader pattern that emerges... Additional DNA relatives among Jewish people from Israel, Türkiye, France, & the broader diaspora demonstrate likewise significant genetic connections. This likely points out to Sephardic Jewish/Crypto-Jewish heritage in my family, specifically « Dönmeh » -- Ottoman Jews who masqueraded as Muslims but secretly remained Jewish. The concentration of DNA matches within Jewish populations suggests endogamy within these communities, explaining the persistence of shared genetic segments across the geographically dispersed Jewish diaspora. To add, the Zevi connection proves especially intriguing as the family is associated with the Sabbatai Zevi, the founder of the Dönmeh Jewish sect of the Ottoman Empire. The finding aligns with linguistic evidence—the etymology of my surname Daoud (Arabic: داود, ; Hebrew: דָּוִד) shows it's the Arabic adaptation of the biblical name David[1]—and historical context regarding Iberian Jews fleeing the Spanish Inquisition to the Maghreb during the 15th century. Further echoing this finding was the presence of numerous Spaniards' DNA matches and my modest but telling 1% Spanish ancestry, likely hinting at the 800-year Moorish era when Maghrebis ruled Spain, aka « Al-Andalus ».
The Ottoman connection (6.7% Anatolian ancestry) corroborates family oral stories with multiple Turkish DNA relatives—exactement as I'd predict. Finally, the high percentage of shared DNA (and to a lesser extent, smaller segments) with elderly ethnic French women suggests intermarriages between « Pieds-noirs » French settlers who lived in Algeria from 1830 to 1962.
What I show here transcends simple personal genealogy. This computational analysis attests to participation in the grand Mediterranean mélange—Moors, Arabs, Berbers, Jews, Turks, Italians—creating ancestral networks of such complexity rendering singular ethnic classifications reductive and ahistorical.
Technical Challenges and Solutions
This project presented several technical challenges specific to analyzing North African and Mediterranean ancestry:
1. Data Privacy Concerns
I had to carefully handle my genetic data, creating secure local storage and processing pipelines rather than using cloud services. This was especially important given the sensitive nature of ethnic heritage information.
2. Standardization Issues
Each service uses different reference populations and labels for North African and Middle Eastern regions, making direct comparisons challenging. For example, what 23andMe calls "Arab, Egyptian & Levantine," AncestryDNA separates into distinct "Levant" and "Arabian Peninsula" regions. I implemented the following normalization technique:
# Function to standardize regional categories
def standardize_regions(service_data, service_name):
    standardized = {}

    if service_name == '23andMe':
        # Map 23andMe specific categories to standard categories
        standardized['North African'] = service_data.get('North African', 0)
        standardized['Levantine/Middle Eastern'] = service_data.get('Levantine', 0) + service_data.get('Egyptian', 0)
        standardized['Southern European'] = service_data.get('Southern European', 0) + service_data.get('Italian', 0)
        # Continue for other regions...

    elif service_name == 'AncestryDNA':
        # Map AncestryDNA specific categories
        standardized['North African'] = service_data.get('Northern Africa', 0)
        standardized['Levantine/Middle Eastern'] = service_data.get('Levant', 0)
        # Continue mapping other regions...

    return standardized
3. Reference Population Bias
DNA testing companies have historically had smaller reference populations for North African and Middle Eastern regions compared to European ones. This required careful weighting in my algorithm based on each company's strengths for specific regions.
4. Ancient Population Mapping
Interpreting the MyHeritage Ancient Origins results required additional research to understand how these historical populations relate to modern-day regions and migrations.
Future Directions
I'm continuing to develop this project in several ways as follows:
- Health-Focused Genetic Analysis: Developing tools to analyze genetic variants relevant to health conditions that are more prevalent in Mediterranean populations, while forbidding the sale of such information—since you or your relatives could be denied medical insurance as a result—and emphasizing the importance of genetic counseling
- Extended Family Testing: Testing older relatives to unlock deeper generational insights—regrettably, my grandfather's 98-year-old sister declined my request, even though her DNA would have provided an ocean of valuable information and DNA relatives
- Ancient DNA Comparison: Exploring how my DNA compares to ancient samples from North Africa and the Levant through public databases of archaeogenetic information
- Historical Migration Visualization: Building an interactive map that shows the gene flow/historical migrations relevant to my specific haplogroups (K1 and J-CTS5368) and how they align with known historical movements of people throughout the Mediterranean. This will require incorporating both mitochondrial DNA (mtDNA) and Y-chromosome DNA (Y-DNA) data.
- MENA-Focused Analysis Tool: Creating an open-source tool specifically optimized for people with MENA & Mediterranean ancestry, as these regions are often less granularly represented in commercial DNA tests
- ML-Based Ancestry Refinement: Using machine learning techniques to identify patterns across the raw data from all three services to potentially uncover more specific regional connections than any individual test can provide
- Data Integration: Working with heterogeneous data sources and formats from multiple testing companies, giving me practical experience handling real-world inconsistent data formats
- Statistical Analysis: Applying weighted algorithms and normalization techniques to reconcile conflicting data points, which required careful consideration of each source's reliability for specific regions
- Data Visualization: Creating meaningful visualizations of complex relationships between geographical regions, testing methodologies, and historical migrations
- Privacy Engineering: Implementing proper data handling for sensitive genetic and ethnic information, an increasingly critical skill in today's data environment
- Domain Knowledge Transfer: Learning to apply computer science concepts to fields outside my immediate expertise, something that will be valuable as I work across different industries
- Different testing companies can vary significantly in their results, not necessarily because one is "wrong," but because they use different reference populations and methodologies
- The history of human migration is complex and doesn't always align with modern political boundaries
- Our genetic makeup often contains surprising connections that tell stories about historical events and population movements
- Eisenbeth, Maurice. Les Juifs de l’Afrique du Nord: Démographie & Onomastique. Grand Rabbin d'Alger, 1936. p. 119. ↩ Download PDF /* Daoud et un dérivé de David donc juif */
- This project was conducted solely for personal research. All sensitive raw genetic data was handled appropriately.
- This years-long work is driven by genuine scientific interest in genetics, 100% free from any political or religious agenda. I approach these findings as a humanist appreciating the evidence of human movement & mixing.
What I Learned
This project taught me valuable skills that extend beyond genealogy and will be directly applicable to my career as a CS professional:
Final Thoughs
This journey through my Mediterranean heritage demonstrates how CS skills can unlock deeper insights from consumer DNA tests. By applying data science techniques to my genetic data, I was able to create a more nuanced understanding of my ancestry than any single testing service could provide.
The project also taught me valuable lessons about genetic ancestry that go beyond the technical aspects:
For fellow CS students considering similar projects, I'd recommend starting with data standardization as your first step, followed by careful consideration of how to normalize different ancestry categories across platforms.
References
Disclaimer: